


 Gabriel Fitzpatrick
We are currently living through a bizarre operational paradox. In the last two decades, corporate technology stacks have evolved exponentially. We have transitioned from basic email servers to complex CRMs, intelligent routing algorithms, and AI-driven conversational agents. Sales and support organizations have spent, by conservative industry estimates, tens of billions of dollars collectively on this infrastructure, all in pursuit of a single promise: get to the customer faster.
Logically, communication between a buyer and a business should be instantaneous. Yet, tracking historical data against the latest 2026 benchmarks reveals a devastating reality: when it comes to human-to-human connection, we are not getting faster. We are actively getting worse, or at best, treading water on a fifteen-year-old failure.
The crisis of unresponsiveness – defined as failing to provide a meaningful, timely human or AI-driven response once a prospect actually clears the hurdle to message the company – has metastasized. To understand how the modern communication black hole is swallowing pipelines, we must compare the foundational benchmarks of the past with the harsh, multi-sourced realities of 2026.
The Persistent 42-Hour Reality: 2011 vs. 2026
The “gold standard†of inbound sales was established nearly twenty years ago, and the math has never wavered.
- The Historical Benchmark (2007): The landmark Lead Response Management Study conducted by MIT and InsideSales in October 2007 proved that responding to a lead within 5 minutes made an organization 21 times more likely to qualify them compared to waiting 30 minutes.
- The Historical Reality (2011): In March 2011, an audit published in the Harvard Business Review (HBR) tested 2,241 US companies to see if they were meeting the MIT benchmark. They found the average B2B response time was a staggering 42 hours.
Fast forward fifteen years. Billions of dollars have been spent on sales acceleration technology. How much faster are we today?
- The Modern Reality (2026): According to a large 2026 pipeline study by Optifai covering 939 B2B companies, the average B2B response time is now 47 hours, with only 23% of companies responding inside 5 minutes. Aloware’s 2026 Lead Response Time Benchmarks echo this, showing a 42-hour median wait time. A separate 2026 analysis by Artemis GTM, drawn from more than 250,000 inbound leads, arrives at the identical 42-hour median and finds that only about 7% of teams hit the five-minute mark.
- The Wider Range: Other 2026 audits paint an even bleaker picture. RevenueHero’s benchmark of 1,000 B2B SaaS companies found that among the minority who responded at all, the average taken was over a full business day – and that figure excludes the 63.5% who never replied. A 2026 Blazeo study of 573 businesses found 74% missed the five-minute window entirely, even though most of those same companies claimed internally that five minutes was their standard.
Despite all technological advancements, the 42-to-47-hour delay remains stubbornly intact, and by some measures has gotten slightly worse since 2011. Organizations are still delivering painfully slow replies because they treat inbound communication as a batch-processing task rather than a real-time event.
The Decay Curve: Why “Eventually†Isn’t a Strategy
What the 2026 data adds to the original 2011 finding is granularity. Response speed doesn’t degrade lead quality on a straight line – it collapses exponentially, within the first hour.
- Under 5 minutes: roughly 21% qualification rate, versus 2.3% for teams that wait a day or more – a nine-fold gap on the exact same leads (2026 Speed-to-Lead Benchmark, Artemis GTM).
- By the 5-to-30-minute mark, conversion potential has already dropped by close to a third; by 30 minutes, roughly 70% of the original value is gone (GreetNow 2026 Speed to Lead Statistics).
- After 24 hours, less than 5% of the original conversion potential remains, and qualification odds have fallen by as much as 90% from their five-minute peak (GreetNow 2026; Optifai 2026).
The uncomfortable implication is that the 42-hour average isn’t simply “slow†– for the overwhelming majority of leads it lands so far down the decay curve that the response has become functionally equivalent to no response at all.
The Industry Variance: Some Sectors Learned, Most Didn’t
The 42-hour figure is a blended average, and it obscures a wide spread. High-intent, comparison-shopping verticals have been forced to get fast; considered, complex-sale verticals have not.
- Real estate: agents average roughly 15 hours per the National Association of Realtors, even though buyers routinely contact several agents at once and the practical target is under 5 minutes.
- Insurance and solar: quote-stage leads are shopped simultaneously across competitors, pushing the realistic target down to 60–90 seconds.
- Legal services: a 2025 Hennessey Digital study of 1,333 law firms found the median response time had improved from 25–33 minutes in 2021 to about 13 minutes – genuine progress – yet 26% of firms still never respond at all.
- Home services (HVAC, roofing, remodeling): a Hatch analysis of over 132,000 speed-to-lead campaigns found 88% of businesses take longer than 5 minutes to reply, with “one day†the single most common response time.
- B2B SaaS: this is where the paradox is sharpest – the vertical with the most CRM and automation spend per dollar of revenue is also the one still averaging multiple hours to days.
The pattern is consistent: industries where buyers can trivially compare five vendors in five minutes have been forced, by consumer behavior rather than internal discipline, to get fast. Industries with longer, more considered sales cycles have used that cover to let response time drift.
The Non-Reply Epidemic: The Jump from 23% to 63%
While the average response time has stagnated, the rate at which companies completely ignore prospects has skyrocketed. This is where we see the most drastic degradation in customer experience.
- The Historical Benchmark (2011): The 2011 HBR study found that 23% of companies never responded to an inbound web lead at all.
- The Modern Reality (2024–2026): By 2024, a benchmark test by RevenueHero on 1,000 B2B SaaS companies showed the non-response rate had climbed to 63.5%. By 2026, Drift’s Lead Response Report confirmed that 58% of companies still completely fail to respond to web leads, and a separate 2024 Workato study of 114 companies found that not a single one called a fresh lead within five minutes.
How did non-replies jump so dramatically? The answer lies partly in the growing complexity of the digital front door, and partly in how much of the “response time†clock is actually consumed before a human ever sees the lead. Workato’s research found that the average personalized email took nearly 12 hours to go out, and the average phone response took over 14 hours – not because reps are slow, but because enrichment, routing, and assignment steps eat the clock first. A rep who calls within three minutes of seeing a lead can still represent an eight-hour response time if the lead sat unrouted for eight hours beforehand.
As companies implemented strict CRMs, they built walled gardens. When a buyer submits an inbound email that is unstructured – meaning it doesn’t perfectly fit the fields of a web form – legacy CRMs and automated systems struggle to process them efficiently. Instead of reaching a human, these messages fall victim to:
- Unmonitored inboxes: General aliases like contact@ become digital graveyards.
- Email routing failure: Manual and automated routing systems fail to assign the complex query to a specific agent.
- Email that never reaches the CRM: Because the format was irregular, the system drops it entirely, resulting in unopened email.
- Silent enrichment lag: Before a lead is even eligible for routing, it typically passes through data enrichment and deduplication steps that, on their own, can consume most of a business day.
The Automation Backfire: Creating the “Deflection Wallâ€
In the late 2010s, the tech industry promised that chatbots and AI deflection would solve this communication bottleneck. Instead, for many buyers, it has weaponized uncontactability.
- The Promise (2018–2020): Early chatbot adoption promised 24/7 responsiveness and seamless triaging, aiming to bring that 42-hour average down to zero.
- The Reality (2026): Organizations have hidden behind closed communication loops and broken contact forms, making it incredibly difficult for a buyer to reach out in the first place – and when they do get through, the experience frequently disappoints.
According to the Spring 2026 CX Trends Report from Glance.cx, a majority of customers report receiving a “fast†automated response that still left them completely frustrated. A 2026 OnePoll survey of 6,000 consumers commissioned by AnswerConnect found that preference for speaking to a real human had climbed to 85%, while frustration with AI agents had risen to 59% and nearly a third of respondents said they would now hang up rather than continue with a bot. Separately, Qualtrics’ 2026 Customer Experience Trends Report found that close to one in five consumers who used AI for customer service walked away feeling it provided no benefit at all.
There is a technical explanation underneath the frustration: the gap between what companies report as “deflection†and what actually gets resolved. Zendesk’s 2026 CX Trends data puts median enterprise tier-1 deflection at roughly 41%, and industry research cited via Gartner suggests that while AI-driven systems deflect a large share of inbound queries away from a human queue, only a small fraction of those deflected queries are genuinely resolved without any human involvement downstream. A chatbot can report a headline-grabbing deflection rate while quietly sitting on a much lower true resolution rate – the difference is where the doom-loop lives.
When a prospect finds staff with web profiles but no means of contact, or when they are forced to use impersonal generic contact only, the company is engineering unreachability. A bot might reply in three seconds, but an unhelpful reply that traps a buyer in a doom-loop is just an automated non-reply. It is a deflection wall, not a bridge.
The Business Consequences: Shifting Expectations and Revenue Leakage
The financial math behind the 42-hour reality is brutal. Hot leads do not wait for internal routing failures to resolve; they pivot to competitors, causing massive lost sales leads.
- The Historical Baseline (2013): Velocify’s Ultimate Contact Strategy (circa 2013) established the “78% Rule,†finding that 78% of B2B customers buy from the first vendor that responds.
- The Modern Penalty (2026): The 78% rule still holds true in 2026, according to Lead Connect and multiple independent 2026 benchmarks. However, the penalty for missing the first-responder window is far steeper, and companies are now actively tracking it: a 2026 Blazeo report found that 81.2% of companies who take longer than an hour to respond say they can specifically point to leads they lost to a faster competitor.
In 2013, a buyer might tolerate a day-long delay. By 2026, GreetNow’s buyer expectation statistics reveal that 64% of buyers expect real-time responses (under 10 minutes). Gitnux 2026 data shows that delaying a response beyond just 10 minutes drops lead conversion by 40%. Furthermore, B2B teams averaging a 1.6-day response time lose 60% more deals than teams that respond same-day.
Run the arithmetic on a mid-sized pipeline and the leakage is not abstract. A company generating 100 leads a month at a modest cost per lead, converting at a healthy rate when responses are fast, can see a conservative 40% of that pipeline evaporate to slow response alone – which, once you multiply by average deal size rather than just wasted ad spend, routinely runs into six figures a year for a mid-market B2B team. You are paying marketing dollars to acquire a lead, only to hand them directly to a competitor who managed their inbox better.
The Perception Gap
Beyond immediate revenue loss, this unresponsiveness drives severe reputational damage. GreetNow’s 2026 data shows that 53% of buyers will actively switch to a competitor after a single poor response experience. This long-term erosion of brand trust fuels “responsiveness deflation,†creating a perception gap where customers feel completely ignored by public or private bodies – and where the same buyer who was frustrated by a slow human response is, per the AnswerConnect and Qualtrics data above, now also frustrated by the automated alternative meant to replace it. The two failures compound rather than offset each other.
What the Fast Movers Are Doing Differently
A minority of organizations have actually closed the gap, and their approach is instructive because it rarely involves hiring more reps.
- They fix enrichment and routing before they touch response scripts. Because Workato’s data shows most of the 42-hour clock is consumed before a human ever sees the lead, the highest-leverage fix is upstream of the rep, not downstream.
- They pair AI with a human safety net rather than using AI as the wall. Optifai’s 2026 data found that AI-powered routing and auto-response delivered roughly an eight-fold improvement in speed for companies that used it to get leads to a human faster, rather than to keep humans away.
- They measure resolution, not deflection. Following Zendesk’s framing, a contact only counts as “handled†if the customer, the agent, and the business all agree the issue is actually closed – which surfaces the doom-loop problem instead of hiding it behind a favorable-looking automation metric.
- They treat after-hours and unstructured contact as a design problem, not an edge case. With a significant share of inbound inquiries arriving outside business hours, the fast movers build a defined path – human or AI – for messages that don’t fit a web form, instead of letting them fall into an unmonitored inbox.
The Bottom Line
The data over the last twenty years tells a clear story: technology alone does not solve the speed-to-lead crisis. Tacking a chatbot onto a broken inbound process does not generate revenue; it only generates frustration, and the 2026 data suggests buyers are now frustrated by both the old failure mode and the new one simultaneously.
Until organizations decide to dismantle their deflection walls, kill the unmonitored shared inbox, fix the enrichment and routing steps that quietly eat most of the response clock, and implement systems that actually process unstructured enquiries in real time, they will continue to hemorrhage leads into the 42-hour void.
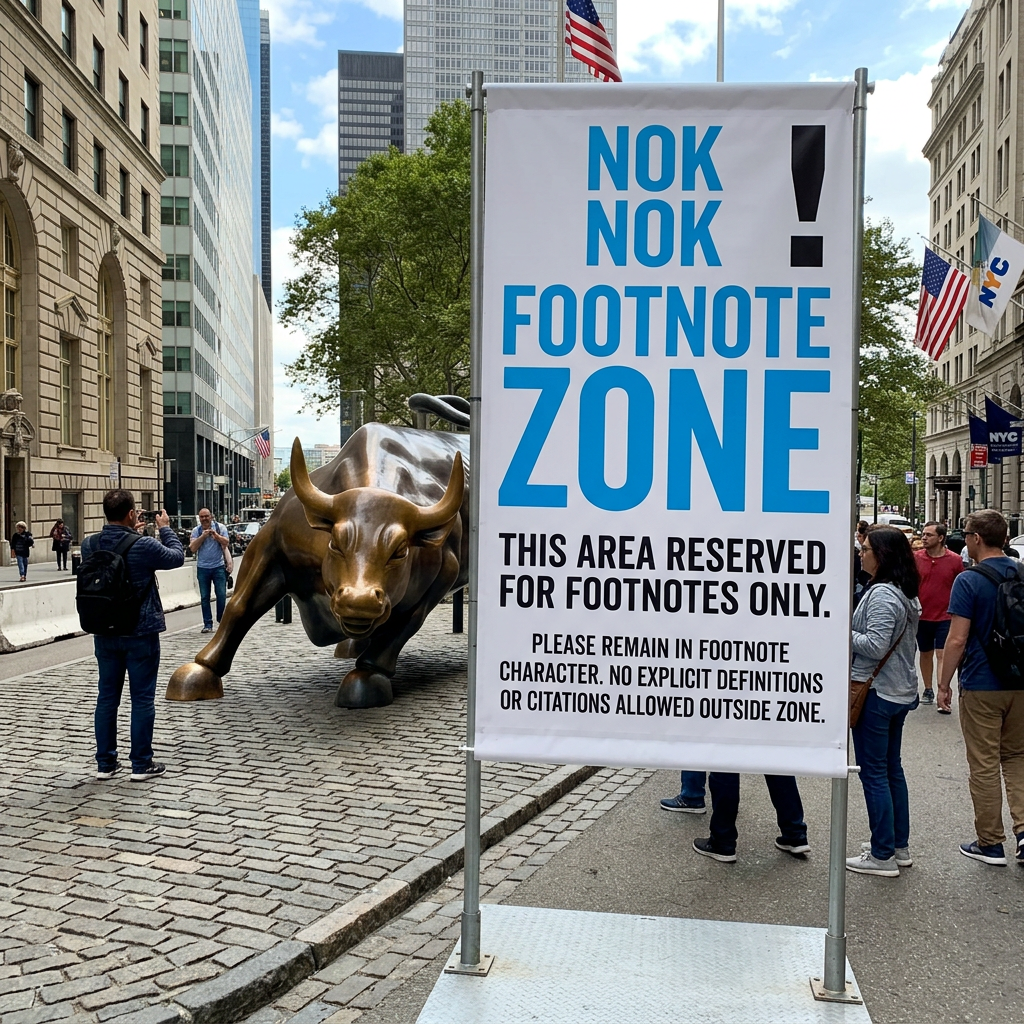
Footnote Zone for The 42-Hour Paradox: Why Two Decades of Tech Upgrades Have Only Made Us Slower
Disclosure: The diagnostic tools referenced below were developed by NokNok, a specialist in online responsiveness tool design.
This Footnote Zone uses NokNok’s diagnostic toolkit to examine how the responsiveness failures described in this article can be identified, measured, and addressed.
- Email Finder: To address the trend of organizations abandoning unmonitored inboxes and obscuring email access behind generic aliases, this tool scans an organization’s website and related public-facing materials for published email addresses, and it reports on structural deficiencies, discrepancies, missing contact routes, or other contactability gaps.
- Reply Radar: Because the modern reality shows skyrocketing non-response rates and delayed replies averaging 42 to 47 hours, this tool deploys targeted test emails and quantitatively measures reply rates, latency, response consistency, and related responsiveness benchmarks.
- Compliance Sniffer: In response to the issue of automated bots delivering fast but unhelpful replies that create frustrating user “doom-loops”, this tool analyzes incoming responses for objective quality, clarity, relevance, escalation, and compliance benchmarks.
- Mystery Shopper: To combat systemic user-experience breakdowns caused by companies building “deflection walls” and obstructive forms, this tool executes a comprehensive end-to-end responsiveness UX audit, thoroughly testing how a real user experiences the organization’s contact, response, and escalation pathways.
Disclosure: The diagnostic tools referenced in this Footnote Zone were developed by NokNok, a specialist in online responsiveness tool design. ReplyResearch may use NokNok tools, resources, or analysis when preparing coverage, while retaining responsibility for its editorial decisions, including what topics to cover, what sources to cite, and how stories are presented. Read the full ReplyResearch Collaborative Disclosure Policy here.

Sources and relevant reading for The 42-Hour Paradox: Why Two Decades of Tech Upgrades Have Only Made Us Slower, MIT and InsideSales published the Lead Response Management Study in October 2007 at https://www.leadresponsemanagement.org/. This foundational research established the five-minute response benchmark, proving organizations are twenty-one times more likely to qualify a lead.
- The Harvard Business Review published The Short Life of Online Sales Leads in March 2011 at https://hbr.org/2011/03/the-short-life-of-online-sales-leads. This audit established the staggering forty-two-hour average response time and identified the twenty-three percent non-response rate.
- Velocify released their Ultimate Contact Strategy research report during 2013, available via https://appexchange.salesforce.com/partners/servlet/servlet.FileDownload?file=00P3000000P3dgaEAB. This historical study established the seventy-eight percent first-responder win rate, highlighting the severe penalty for delayed communications.
- RevenueHero published their B2B SaaS Lead Response Benchmarks in 2024, which can be found at https://www.revenuehero.io/. This critical modern benchmark identified the massive spike in ignored prospects, showing the non-response rate climbed.
Modern Benchmarks and Shifting Buyer Expectations Regarding Technology Response Times Verified by Recent Independent Industry Research Studies and Pipeline Data Reports Across Multiple Continents Today
- Aloware and Optifai released the Lead Response Time Benchmarks in 2026, accessible via https://aloware.com/. This pipeline study verified the modern forty-seven-hour delay, proving that unresponsiveness remains stubbornly intact despite technological upgrades.
- Drift published their definitive Speed-to-Lead Statistics report covering 2025 and 2026, located at https://www.drift.com/. This research verified the modern fifty-eight percent non-response rate, supporting the assessment of how systems create graveyards.
- Glance.cx issued the Spring 2026 CX Trends Report in 2026, accessible at https://glance.cx/. This document identified the seventy-eight percent AI frustration rate, perfectly illustrating the argument about automated deflection walls.
- Gitnux and GreetNow presented the Buyer Expectation Benchmarks in 2026 at https://gitnux.com/. This data verified the ten-minute consumer expectation and conversion drop, highlighting the severe business consequences of ignoring buyers.


